No need to panic on unemployment figures

PIPA chair Peter Koulizos says it’s important to remember our economy and property markets have survived recessions before and will do again this time, too.


Property Investment Professionals of Australia (PIPA) chair Peter Koulizos said that there is no need to panic with the recent release of unemployment figures.
“Homeowners and property investors should take comfort in the resilience of real estate during previous economic upheavals.
“The unemployment rate of 7.4 per cent for June was not unexpected and is set to increase over coming months,” Mr Koulizos said.
“However, the number of employed persons increased at the same time with more people seeking work around the nation last month as restrictions started to ease in many locations.
“The unemployment rate has been trending down for the past four decades, so it’s likely that we will see an unpalatably high number in coming months.
“It’s important to remember that our economy and property markets have survived recessions before and will do again this time, too.
“In fact, we are better placed than in previous downturns because of the many financial support packages, such as JobKeeper, JobSeeker and JobTrainer as well as the mortgage repayment pauses available for borrowers.
“Homeowners and property investors should be reassured by the fact that, historically, real estate has endured through previous economic upheavals.
“Recent PIPA research found that five years after each of the four recessions or economic downturns since the early 1970s, capital city house prices often increased significantly.
“In fact, looking back over the past nearly 50 years, house prices were higher five years after a recession or downturn each time.
“Property has shown its resilience through economic shocks before and we have no reason to expect it won’t do so again so there is no need to panic.”
| 5 years | Sydney | Melbourne | Brisbane | Adelaide | Perth | Hobart | Darwin | Canberra |
| ending | % | % | % | % | % | % | % | % |
| 1980 | 100.7% | 37.6% | 49.7% | 37.7% | 64.7% | 40.2% | N/A | 33.0% |
| 1988 | 64.1% | 67.7% | 20.4% | 31.3% | 61.9% | 51.8% | N/A | 20.2% |
| 1996 | 16.0% | 3.1% | 23.3% | 5.9% | 27.3% | 20.5% | 47.3% | 11.6% |
| 2014 | 39.7% | 18.5% | 6.9% | 7.1% | 11.4% | 1.7% | 16.6% | 8.3% |
Share


Related Articles
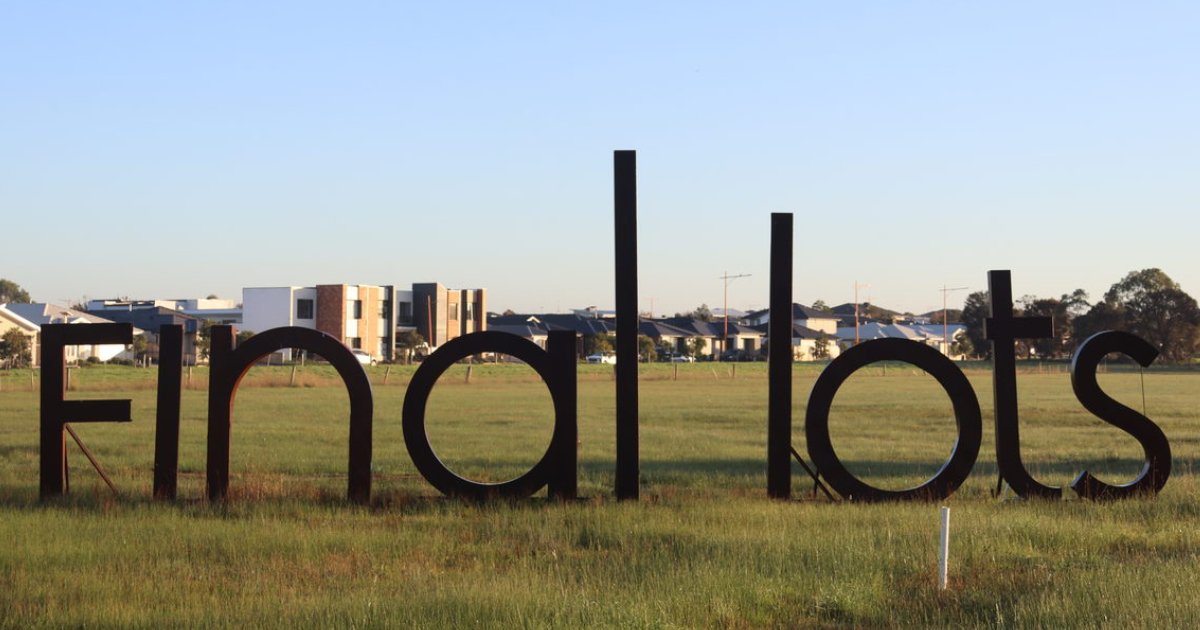
The vision that shaped Armstrong Mt Duneed
AFTER almost two decades of development, Armstrong Mt Duneed is…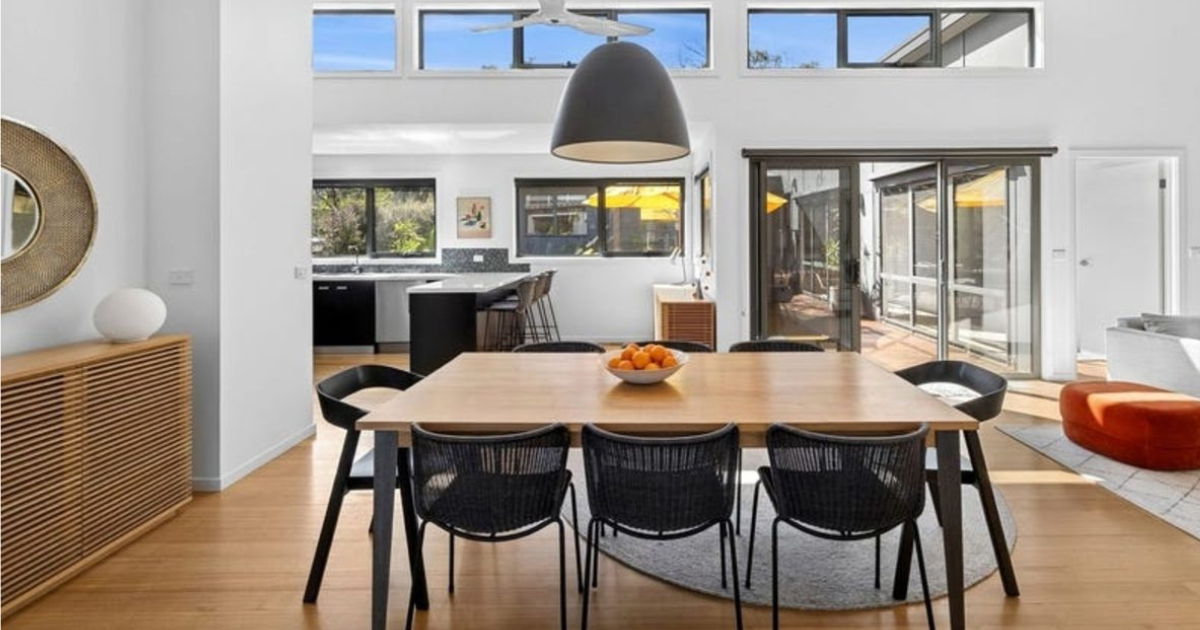
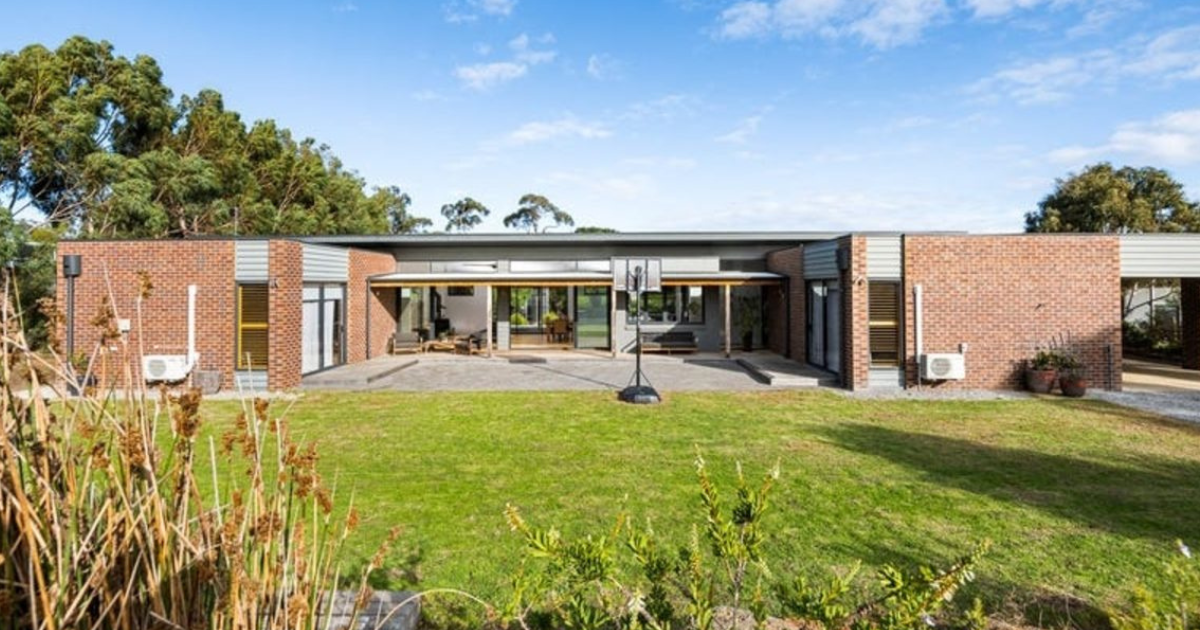
Top marks for residence and location: 22 Cameron Road, Anglesea
SET in a coveted position in the tightly-held pocket of…