House prices up, but so is income

CoreLogic head of research Tim Lawless. Photo: FILE


Housing affordability has improved over the past ten years across most regions of Australia says CoreLogic Head of Research, Tim Lawless.
NATIONALLY, dwelling values have risen at roughly the same pace as household incomes over the past decade providing a relatively steady ratio of dwelling values relative to household incomes. At the same time, mortgage rates have fallen to generational lows, leading to an improvement in loan serviceability.
The decade ending in June 2019 has seen the national median dwelling value rise from $382,650 to $516,710, an annual increase of 3.0 per cent.
At the same time, household incomes – according to estimates from the ANU Centre for Social Research and Methods – have risen at the annual pace of 3.1 per cent up from $59,020 per annum in 2009 to $79,872 in 2019.
Over the same period, average mortgage rates – according to RBA statistics – fell from 5.1 per cent in 2009 to 4.1 per cent in June this year.
The wash up from these movements is that housing affordability, based on the ratio of dwelling values to household incomes, is broadly unchanged across Australia and households are generally dedicating less of their income towards servicing a new mortgage.
Nationally, the ratio of dwelling values to household incomes has varied over the past decade, moving through a low of 6.1 in late 2012 to a recent high of 7.0 in early 2018. In June 2019 the ratio was recorded at 6.5 which is equivalent to where it was in 2009. A ratio of 6.5 simply means the typical Australian household is spending 6.5 times their gross annual household income in order to purchase the typical dwelling.
While the national reading is the same as it was ten years ago, five of the eight capital cities and four of the seven noncapital city regions have recorded an improvement in the ratio of dwelling values to household incomes. The lowest ratio can be found in Darwin where the typical household is spending only 3.4 times their gross annual household income to purchase a dwelling, down from 5.6 ten years ago).
While most areas have seen housing, values become more affordable relative to incomes, some areas have seen affordability worsen. Sydney, Melbourne and Hobart have seen housing values rise at a faster rate than household incomes which has eroded affordability.
Across the regional areas of Australia, the only areas where the ratio of dwelling values to household incomes has worsened is regional NSW, and regional Victoria, which was 4.9 in 2009, and now sits at 5.6 in 2019.
It’s a similar story with mortgage serviceability. Despite mortgage rates falling to the lowest level since at least the 1950 households in Sydney, Melbourne and Hobart are generally dedicating a larger proportion of their incomes towards servicing a new mortgage than they were in 2009.
Share


Related Articles
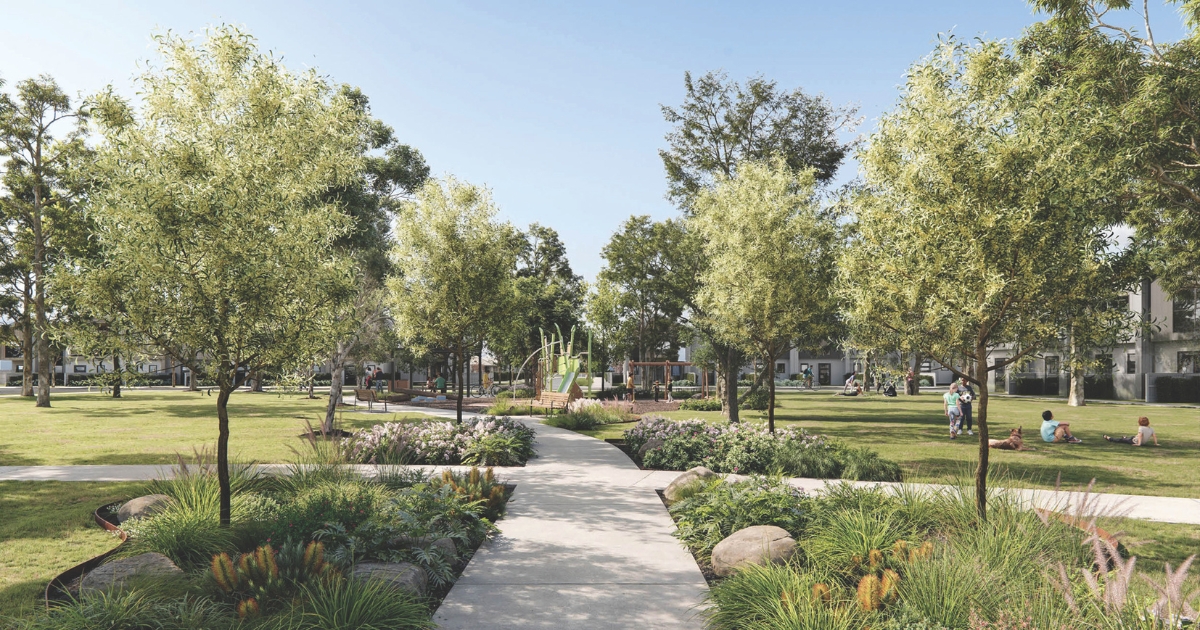
New development announced for Corio
Developer Cedar Woods Properties has announced a new 400-home project…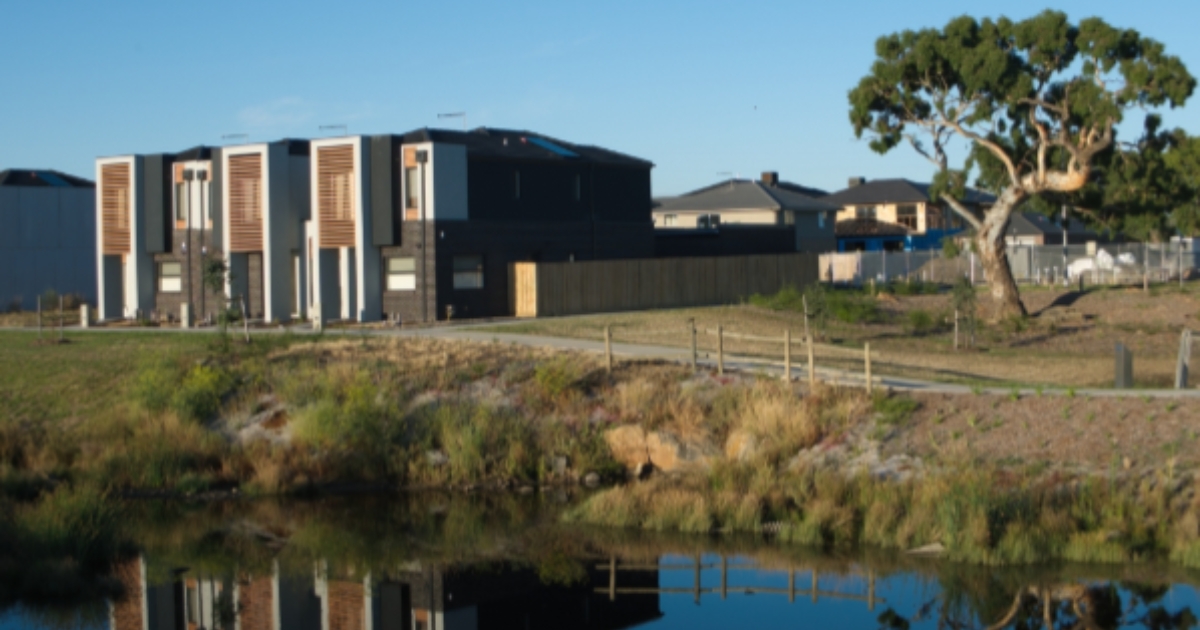
Townhouse Living: Is it the right fit for your family?
As one of Australia’s most high-activity real estate markets, townhouses…