Top 10 market highlights

10 CoreLogic key market metrics making headlines in March.


Slowing buyer demand, tighter lending conditions and affordability constraints contributed to an easing in Australia’s national home value growth rate in February according to CoreLogic’s most recent research.
The lowest rate of growth since October 2020 coincided with a new record high for the residential market’s combined value, which hit $9.8 trillion at the end of February, up from $9.7 trillion in the previous month.
Australia’s household wealth is underpinned by residential real estate, now worth almost $3 trillion more than superannuation, the Australian listed stocks and commercial real estate combined.
Leading indicators such as listings, clearance rates and lending figures provide a comprehensive reading of the residential property market and factors.
10 CoreLogic key market metrics making headlines in March:
1. Dwelling values soften – Dwelling values in Australia are 20.6 per cent higher over the past 12 months (0.6 per cent gain in February) which is down from the recent high of 22.4 per cent in the 12 months to January and market peak of 2.8 per cent in March 2021.
2. Highest and lowest growth rate – The highest annual growth rate in dwelling values among the regional and capital city dwelling markets was across Brisbane, at 29.7 per cent. The lowest rate of appreciation in values was across Regional NT, at 7.1 per cent. Lower value segments continue to firmly lead growth. In the three months to February, capital city homes saw the top quartile of values rise 0.8 per cent, compared to 3.4 per cent across the lowest quartile of values.
3. Elevated sales volumes – Sales volumes rose 37.7 per cent in the 12 months to February, to an estimated 650,175. Transaction volumes through the month of February remained elevated at an estimated 57,427, which is 46.1 per cent above the previous five-year February average.
4. Slightly longer days on market – Properties are taking slightly longer to sell at the national level, as new listings volumes rise. In the three months to February, the median number of days on number was recorded at 30, up from a recent low of 21 days in the three months to December.
5. Record low discounting levels – Discounting levels are around record lows, reflecting strong selling conditions. However, vendor discounting has deepened slightly across the combined capital city market in recent months, to -3.2 per cent.
6. Advertised stock on the rise – More advertised stock is being added to the market than usual. At the national level, the four weeks to March 6 saw new listings trend 4.8 per cent higher than the equivalent period of 2021. At the national level, total listings remain well below the average for this time of the year, as high sales volumes have seen around 1.2 sales for every new listing added to the market in recent months.
7. Clearance rates soften – Clearance rates averaged 72.4 per cent in the four weeks to February 27, down from 78.8 per cent in the equivalent period of 2021. Clearance rates are expected to trend lower amid softer housing value growth.
8. Rent values rise – In the year to February, Australian rent values increased 8.7%, which was down from a recent cyclical high of 9.4 per cent in the 12 months to November.
9. Approvals fall – Detached house approvals fell -17.3 per cent through January, following a surge in approvals between August 2020 and December 2021. Unit approvals totalled 4,045 in January, which is the lowest read since July 2012.
10. Record high lending – Lending for property purchases reached a new record high through January 2022 (at around $33.7 billion). This included a record $11 billion to investor purchasers. Despite these record highs, growth in lending slowed to 2.6 per cent through the month, down from 4.4 per cent in the previous month.
Share


Related Articles
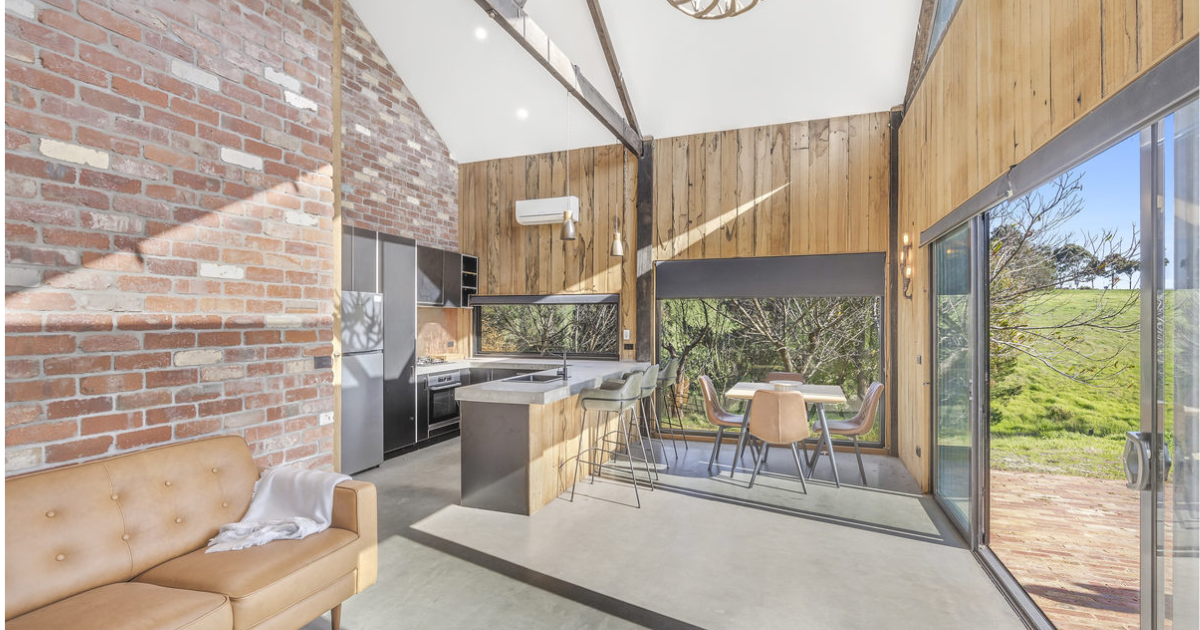
Untapped commercial agricultural opportunity on the Bellarine
A 10-acre Bellarine property combining a modern barn, large commercial…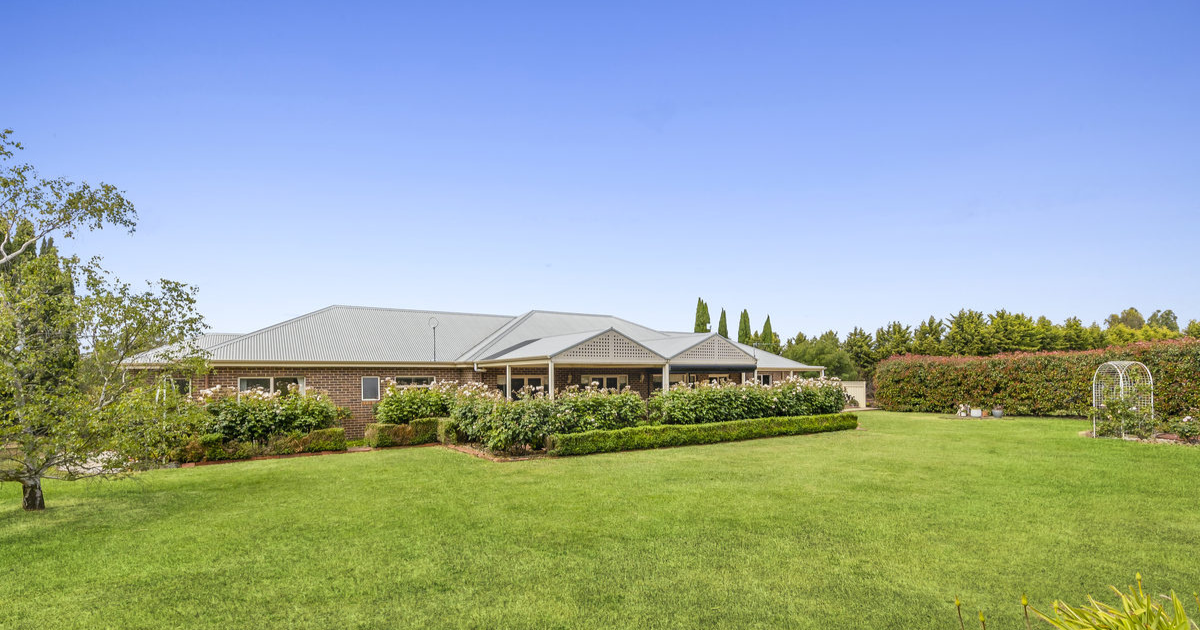
An outstanding country estate
CHARLES Stewart has listed a manageable-sized rural oasis in the…