Numbers tell the story

REIV president Leah Calnan.


REIV President Leah Calnan says Victorian property values continue to defy gloomy price predictions and are holding firm despite six months of the Coronavirus pandemic.
The quarterly median prices for the September Quarter 2020 released by the Real Estate Institute of Victoria have highlighted remarkable resilience in the Victorian property market.
The highlight of the September Quarter is Regional Victoria. Regional Houses set a new quarterly record at $442,500 recording incredible growth at 5.1 per cent for the quarter and 4.9 per cent over the last 12 months.
Regional units have fallen slightly to $327,000, down 3.1 per cent from the past quarter but are 8.0 per cent more valuable than they were 12 months ago.
The varying levels of restrictions placed on Melbourne Metro and Regional Victoria over the last couple of months impacted transaction volumes as expected. While transaction numbers in Melbourne plummeted by 31 per cent compared to the June Quarter, transactions in Regional Victoria soared by 15 per cent.
Market restrictions meant fewer properties were listed for sale keeping prices relatively stable over the quarter. House values in Metropolitan Melbourne remain strong falling by just 1.7 per cent during the September Quarter to a median price of $846,000 while recording a 7.4 per cent annual growth.
Units in Melbourne have achieved a median price of $622,500, which is 0.2 per cent higher than the June Quarter and an annual increase of 5.4 per cent.
Sales by private treaty increased in popularity with Units in Melbourne Metro even recording 0.8 per cent growth to a new record surpassing $600k for the first time.
These results come amongst a backdrop of incredible and ongoing change in the Victorian property market.
REIV President Leah Calnan said the Victorian property market has survived everything thrown at it in 2020.
“Despite six months of Covid-19, lockdowns and moratoriums, the Victorian Property Market continues to prosper with properties remaining more valuable than they were in 2019” Ms Calnan said.
“Our members have faced so many challenges in 2020, their work and efforts are evidenced in the September Quarter results.”
“REIV market statistics are based on results directly sourced from agents and government records and provide a true picture of Victorian real estate”
| Sep-20 Quarter | Jun-20 Quarter | Quarterly Change | 12 months to Sep-20 Quarter | 12 months to Sep-19 Quarter | Annual Change | ||||||||||
| Metropolitan Melbourne | |||||||||||||||
| House | $846,000 | $861,000 | -1.7% | $875,000 | $815,000 | 7.4% | |||||||||
| Unit and Apartment | $622,500 | $621,000 | 0.2% | $631,311 | $599,000 | 5.4% | |||||||||
| Regional Victoria | |||||||||||||||
| House | $442,500 | $421,000 | 5.1% | $430,000 | $410,000 | 4.9% | |||||||||
| Unit and Apartment | $327,000 | $337,500 | -3.1% | $317,500 | $294,000 | 8.0% | |||||||||
| Regional Victoria | |||||||||||||||
| Median House Prices by Municipality & Suburb, Original | |||||||||||||||
| 12 months ending September 2020 | |||||||||||||||
| *Indicates that less than 50 sales were recorded during the 12 months ending period | |||||||||||||||
| Suburb | Lower Quartile | Sep-20 Median | Upper Quartile | Jun-20 Median | Quarterly Change | Annual Change | |||||||||
| MOUNT MACEDON* | $875,000 | $1,282,500 | $2,180,000 | $1,215,000 | 5.6% | – | |||||||||
| BARWON HEADS | $838,000 | $1,050,000 | $1,390,000 | $971,250 | 8.1% | 4.0% | |||||||||
| ANGLESEA* | $850,000 | $970,000 | $1,155,000 | $1,100,000 | -11.8% | 20.1% | |||||||||
| SURF COAST | $795,000 | $915,500 | $1,165,000 | $921,000 | -0.6% | 10.8% | |||||||||
| NEWTOWN | $765,000 | $910,000 | $1,180,000 | $897,500 | 1.4% | 13.8% | |||||||||
| QUEENSCLIFF* | $780,000 | $875,000 | $1,600,000 | $927,500 | -5.7% | -4.4% | |||||||||
| TORQUAY | $750,000 | $872,500 | $1,044,500 | $872,500 | 0.0% | 5.1% | |||||||||
| QUEENSCLIFFE | $741,000 | $865,000 | $1,250,000 | $905,000 | -4.4% | -6.2% | |||||||||
| POINT LONSDALE* | $730,000 | $840,000 | $1,010,000 | $828,750 | 1.4% | 1.4% | |||||||||
| GISBORNE | $645,000 | $830,000 | $952,500 | $815,000 | 1.8% | 3.1% | |||||||||
| LAKE WENDOUREE* | $452,000 | $820,000 | $1,250,000 | $860,000 | -4.7% | 10.7% | |||||||||
| GEELONG* | $640,000 | $800,000 | $1,150,000 | $750,000 | 6.7% | 10.7% | |||||||||
| WOODEND | $672,500 | $780,000 | $1,000,000 | $770,000 | 1.3% | -6.0% | |||||||||
| MACEDON RANGES | $625,000 | $775,000 | $975,000 | $760,000 | 2.0% | 3.9% | |||||||||
| EAST GEELONG* | $620,000 | $765,000 | $965,000 | $725,000 | 5.5% | 29.7% | |||||||||
| MANIFOLD HEIGHTS* | $629,250 | $755,000 | $1,134,500 | $725,000 | 4.1% | 6.5% | |||||||||
| NEERIM SOUTH* | $580,000 | $740,000 | $779,000 | $660,000 | 12.1% | 50.9% | |||||||||
| RIDDELLS CREEK* | $625,000 | $740,000 | $900,000 | $797,500 | -7.2% | -14.4% | |||||||||
| OCEAN GROVE | $647,000 | $732,500 | $860,000 | $706,500 | 3.7% | 5.2% | |||||||||
| SMYTHES CREEK* | $545,000 | $728,500 | $825,000 | $652,000 | 11.7% | 12.1% | |||||||||
| GEELONG WEST | $640,000 | $720,000 | $934,500 | $750,000 | -4.0% | 5.9% | |||||||||
| NEW GISBORNE* | $650,000 | $720,000 | $835,000 | $740,000 | -2.7% | -7.7% | |||||||||
| Regional Victoria | |||||||
| Median House Prices by Suburb, Original | |||||||
| 12 months ending September 2020 | |||||||
| Note: Only suburbs where a minimum of 50 sales included. | |||||||
| Most Expensive | Suburb | Sep-20 Median | Quarterly Change | Annual Change | |||
| 1 | BARWON HEADS | $1,050,000 | 8.1% | 4.0% | |||
| 2 | NEWTOWN | $910,000 | 1.4% | 13.8% | |||
| 3 | TORQUAY | $872,500 | 0.0% | 5.1% | |||
| 4 | GISBORNE | $830,000 | 1.8% | 3.1% | |||
| 5 | WOODEND | $780,000 | 1.3% | -6.0% | |||
| 6 | OCEAN GROVE | $732,500 | 3.7% | 5.2% | |||
| 7 | GEELONG WEST | $720,000 | -4.0% | 5.9% | |||
| 8 | HIGHTON | $711,250 | 2.3% | 3.1% | |||
| 9 | KYNETON | $665,000 | 2.3% | 10.9% | |||
| 10 | DAYLESFORD | $660,000 | -1.5% | 10.0% | |||
| Most Affordable | Suburb | Sep-20 Median | Quarterly Change | Annual Change | |||
| 1 | STAWELL | $199,000 | -0.3% | -5.2% | |||
| 2 | MORWELL | $205,000 | 2.5% | 9.0% | |||
| 3 | CHURCHILL | $225,500 | 4.9% | 20.6% | |||
| 4 | HORSHAM | $226,000 | -3.8% | -7.8% | |||
| 5 | ARARAT | $235,500 | 1.1% | 9.5% | |||
| 6 | RED CLIFFS | $243,000 | 2.9% | -3.3% | |||
| 7 | PORTLAND | $265,000 | -0.8% | 5.0% | |||
| 8 | MARYBOROUGH | $270,000 | -0.6% | 10.2% | |||
| 9 | BENALLA | $282,000 | -1.1% | 4.1% | |||
| 10 | BAIRNSDALE | $288,000 | 1.1% | 5.1% | |||
Share


Related Articles
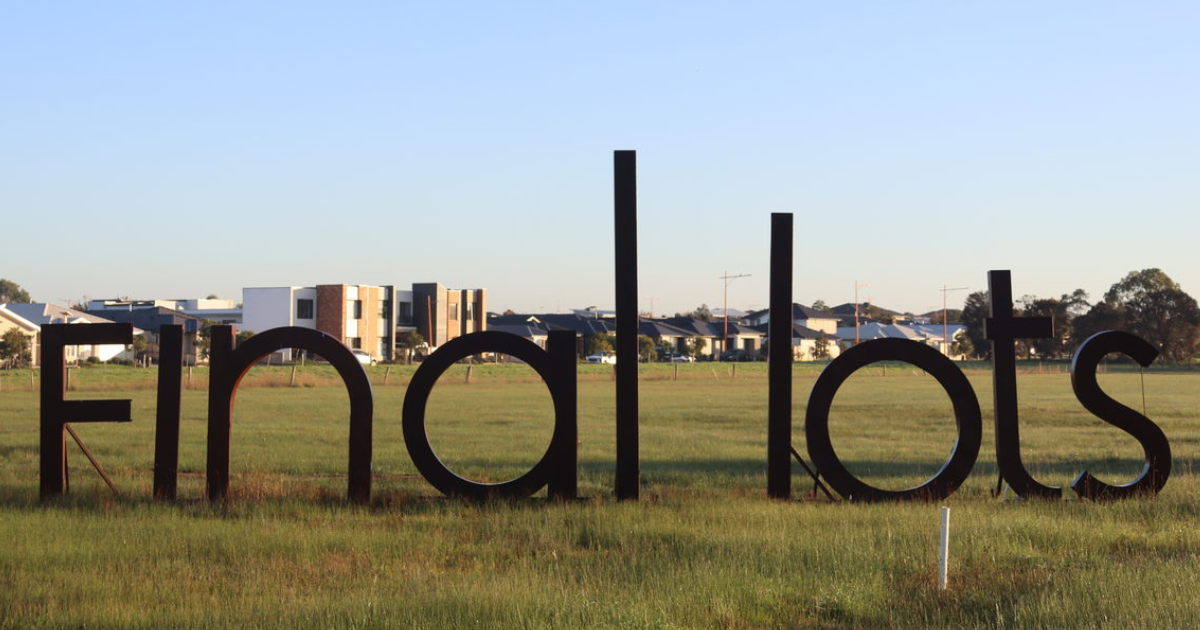
The vision that shaped Armstrong Mt Duneed
AFTER almost two decades of development, Armstrong Mt Duneed is…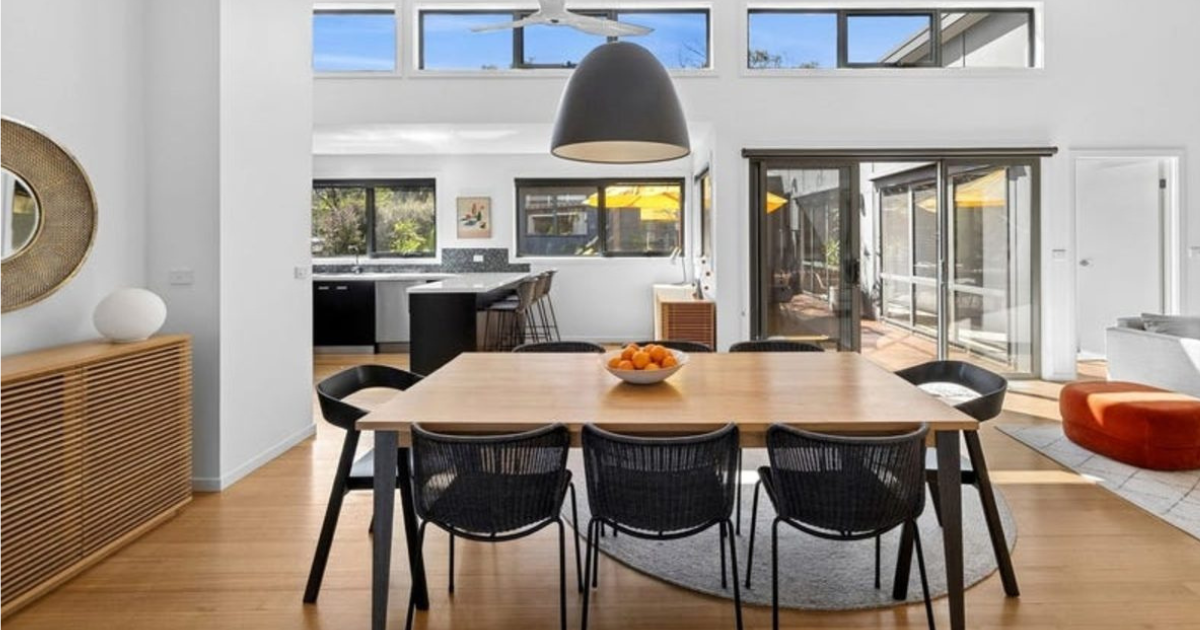
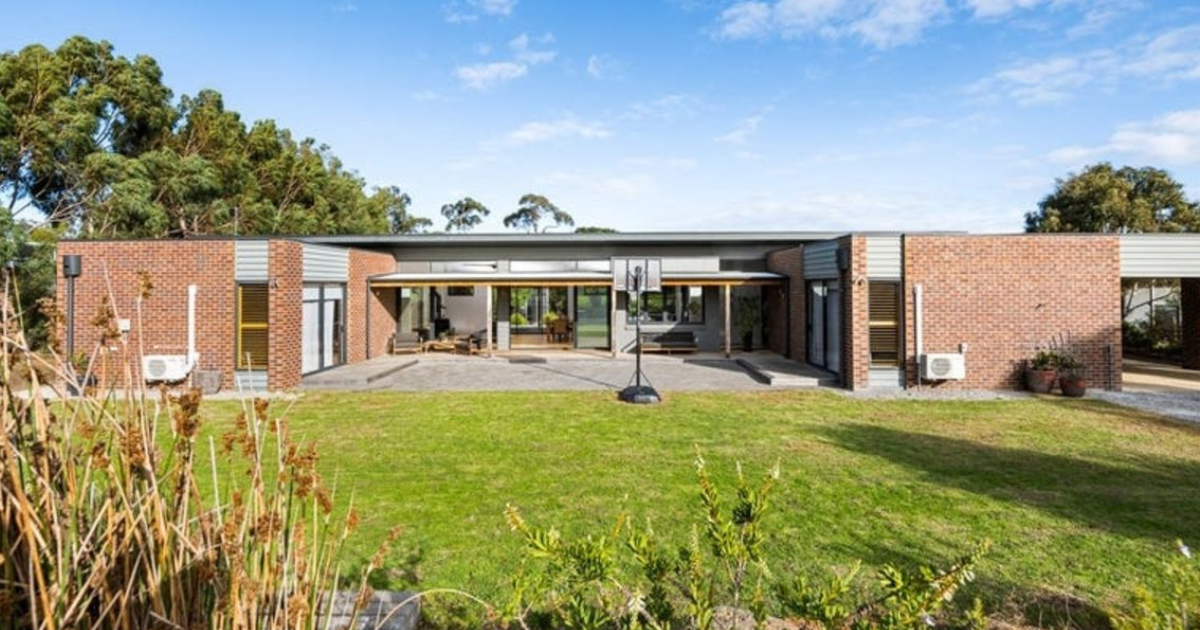
Top marks for residence and location: 22 Cameron Road, Anglesea
SET in a coveted position in the tightly-held pocket of…